ZingChart: Setting the height and width of a marker
ZingChart has 2 different features which have similar names marker or markers. While the names are very similar the features are very different. This article will discuss how to set the size of a marker . A marker is the individual shapes (by default circles) plotted along a line which represents a data point.
If you are looking for documentation on markers which are used to create lines and/or shaded regions for specific areas on a chart to indicate a range, threshold or trendline you might start at this markers doc:
To continue with marker , you can configure the marker in your charts in two different places:
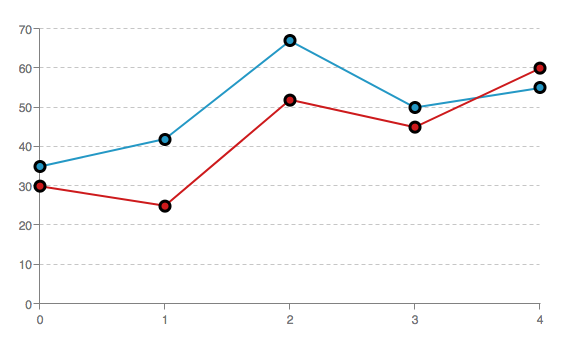
Directly in plot:{} to apply the configuration to all plots.
{
 type: 'line',
 plot:{
     marker:{  //control the marker for all plots
         size: 5,
 	 borderWidth: 3,
 	 borderColor: 'black'
     }
 },
 series: [
    {
	values: [35,42,67,50,55]
    },
    {
	values: [30,25,52,45,60]
    }
]
};
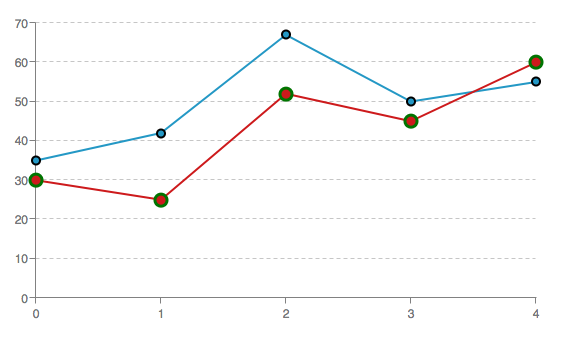
Individually in series:[] to set each plot separately.
{
 type: 'line',
 series: [
    {
	values: [35,42,67,50,55],
        marker:{  //control the marker a single plot
            size: 4,
 	    borderWidth: 2,
 	    borderColor: 'black'
 	}
    },
    {
	values: [30,25,52,45,60],
        marker:{  //control the marker a single plot
            size: 6,
 	    borderWidth: 3,
 	    borderColor: 'green'
 	}
    }
]
}
It should be noted you can leverage plot and series together to style your markers since plot will apply to all plots and series is more specific so it will effect just a single plot. For more details on this you can view our:
Plot and Series Styling Tutorial
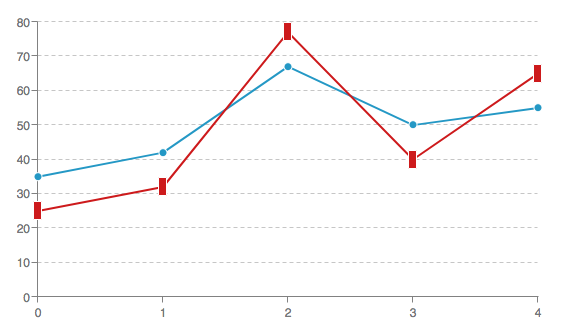
Setting the height and width of a marker is actually done by simply setting the size attribute. In some case such as "rect" and "parallelogram" shapes you can actually set size and size2 to address height and width.
{
 type: 'line',
 series: [
    {
      values: [35,42,67,50,55],
      marker:{
        size: 4 //sets the size which equally effects height and width
       }
    },
    {
      values: [25,32,77,40,65],
      marker:{
        type: 'rect',
        size: 8, //sets the width
        size2: 18 //sets the height
       }
    }
  ]
};
ZingChart does provide a lot of features and customization around marker . Whether you are trying to set the style of marker with Rule based styling or if you just need a full list of attributes:
http://www.zingchart.com/docs/json-attributes-syntax/plot-series-item-objects/marker/
Please feel free to reach out if you have additional questions.