ZingChart: Scorecard chart!
Scorecards are a new type of chart introduced to the Zingchart library.
Here is an example of what they look like:
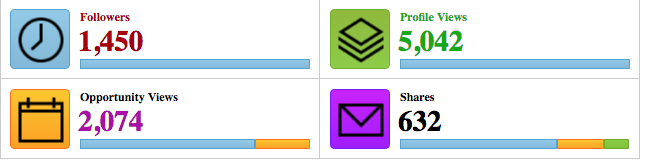
Scorecards are useful to display bar graphs in an aesthetic way. It includes a graphic, value text and a bar chart that is interactive with tooltips.
We usually call more than one scorecard at a time. In this example we are going to be calling four scorecards.
Let's start building the chart JSON. In our root object, we are going to be setting globals and the layout.
var myConfig= {
    "globals": {
        "font-family": "Lucida Sans Unicode"
    },
    "layout": "2x2",
As you can see we have set the layout to 2x2 which will set our four scorecards in a 2 by 2 row. Now we can move onto the graphset . This is where all the important chart data will live. We will set the type to "scorecard" and borders on the top, bottom, left and right.
"graphset": [
        {
            "type": "scorecard",
            "border-top": "1px solid #ccc",
            "border-right": "1px solid #ccc",
            "border-bottom": "1px solid #ccc",
            "border-left": "1px solid #ccc",
The options object is where the title , value , bars and icon will be set. This is where all the data lives for the actual scorecard. Inside the options object, the title object is set where we set the text and color of the text. For example, our first text object will look like this:
"title": {
        "text": "Opportunity Views"
    },
The value object sets the text number and the color of the number. I will set this color the same as the title.
"value": {
        "text": "2,074",
        "color": "#a0a"
    },
The icon object is where we set the icon image, border, background color and scale of the icons. Here we will be setting the scale to 0.75 so that it fits our use case and will call in the image using "background-image" .
"icon":{
        "background-color": "#ffc90e #ffa100",
        "border-color": "#ff7200",
        "background-scale": 0.75,
        "background-image": "/studio/demo/LM9PTBOF/calendar.png"
    },
Our next section is only applicable if we want more than one color for our bars. For example, if our bar only consists of one value, therefore 100%, then the bars array would not be needed. Here is an example of how we set bars when we need more than one color for the bars. We set the text , and the value .
 "bars": [
        {
            "text": "FaceBook Views",
            "value": 1574
        },
        {
            "text": "Pinterest Views",
            "value": 500
        }
    ]
The last thing we will include is having the plotarea set margins so that we have some spacing between our scorecard and the borders. I will set margin:10 on our cards.
Now that we have created one, we will repeat the process for the other three cards until we have all four cards. We are using four cards because we specified this earlier in our layout object.
Here is an example of how our myConfig variable should look when we completed making four different scorecards in our main graphset .
var myConfig= {
    "globals": {
        "font-family": "Lucida Sans Unicode"
    },
    "layout": "2x2",
    "graphset": [
        {
            "type":"scorecard",
            "border-top":"1px solid #ccc",
            "border-right":"1px solid #ccc",
            "border-bottom":"1px solid #ccc",
            "border-left":"1px solid #ccc",
            "options": {
                "title": {
                    "text": "Followers",
                    "color": "#a00"
                },
                "value": {
                    "text": "1,450",
                    "color": "#a00"
                },
                "icon": {
                    "background-scale": 0.75,
                    "background-image": "/studio/demo/LM9PTBOF/clock.png"
                }
            },
            "plotarea": {
                "margin": 10
            }
        },
        {
            "type": "scorecard",
            "border-top": "1px solid #ccc",
            "border-right": "1px solid #ccc",
            "border-bottom": "1px solid #ccc",
            "options": {
                "title": {
                    "text": "Profile Views",
                    "color": "#0a0"
                },
                "value": {
                    "text": "5,042",
                    "color": "#0a0"
                },
                "icon": {
                    "background-color": "#8eba31 #8dcd41",
                    "border-color": "#6fb023",
                    "background-scale": 0.75,
                    "background-image": "/studio/demo/LM9PTBOF/layes.png"
                }
            },
            "plotarea": {
                "margin": 10
            }
        },
        {
            "type": "scorecard",
            "border-right": "1px solid #ccc",
            "border-bottom": "1px solid #ccc",
            "border-left": "1px solid #ccc",
            "options": {
                "title": {
                    "text": "Opportunity Views"
                },
                "value": {
                    "text": "2,074",
                    "color": "#a0a"
                },
                "icon": {
                    "background-color": "#ffc90e #ffa100",
                    "border-color": "#ff7200",
                    "background-scale": 0.75,
                    "background-image": "/studio/demo/LM9PTBOF/calendar.png"
                },
                "bars": [
                    {
                        "text": "FaceBook Views",
                        "value": 1574
                    },
                    {
                        "text": "Pinterest Views",
                        "value": 500
                    }
                ]
            },
            "plotarea": {
                "margin": 10
            }
        },
        {
            "type": "scorecard",
            "border-right": "1px solid #ccc",
            "border-bottom": "1px solid #ccc",
            "options": {
                "title": {
                    "text": "Shares"
                },
                "value": {
                    "text": "632"
                },
                "icon":{
                    "background-color": "#c90eff #a100ff",
                    "border-color": "#7200ff",
                    "background-scale": 0.75,
                    "background-image": "/studio/demo/LM9PTBOF/email.png"
                },
                "bars": [
                    {
                        "text": "FaceBook Shares",
                        "value": 432
                    },
                    {
                        "text": "Pinterest Shares",
                        "value": 130
                    },
                    {
                        "text": "Other Shares",
                        "value": 70
                    }
                ]
            },
            "plotarea": {
                "margin": 10
            }
        }
    ]
};
Our last important piece of information would be to set the entire height and width of all 4 charts in our render method. For our specific icons and sizing, we have determined a height of 160 and width of 640 is optimal. Also, we must call the modules:'scorecard' in our render method.
zingchart.render({
    id: 'myChart',
    data: myConfig,
    height: 160,
    width: 640,
    modules : 'scorecard'
});
Our final scorecard chart is going to look like this:
Relevant Links: